Backtesting
15 years of verified market data at your fingertips in seconds - visualize movers, patterns, and setups across any timeframe or market condition.
How It Works
Turn historical data into actionable trading intelligence.
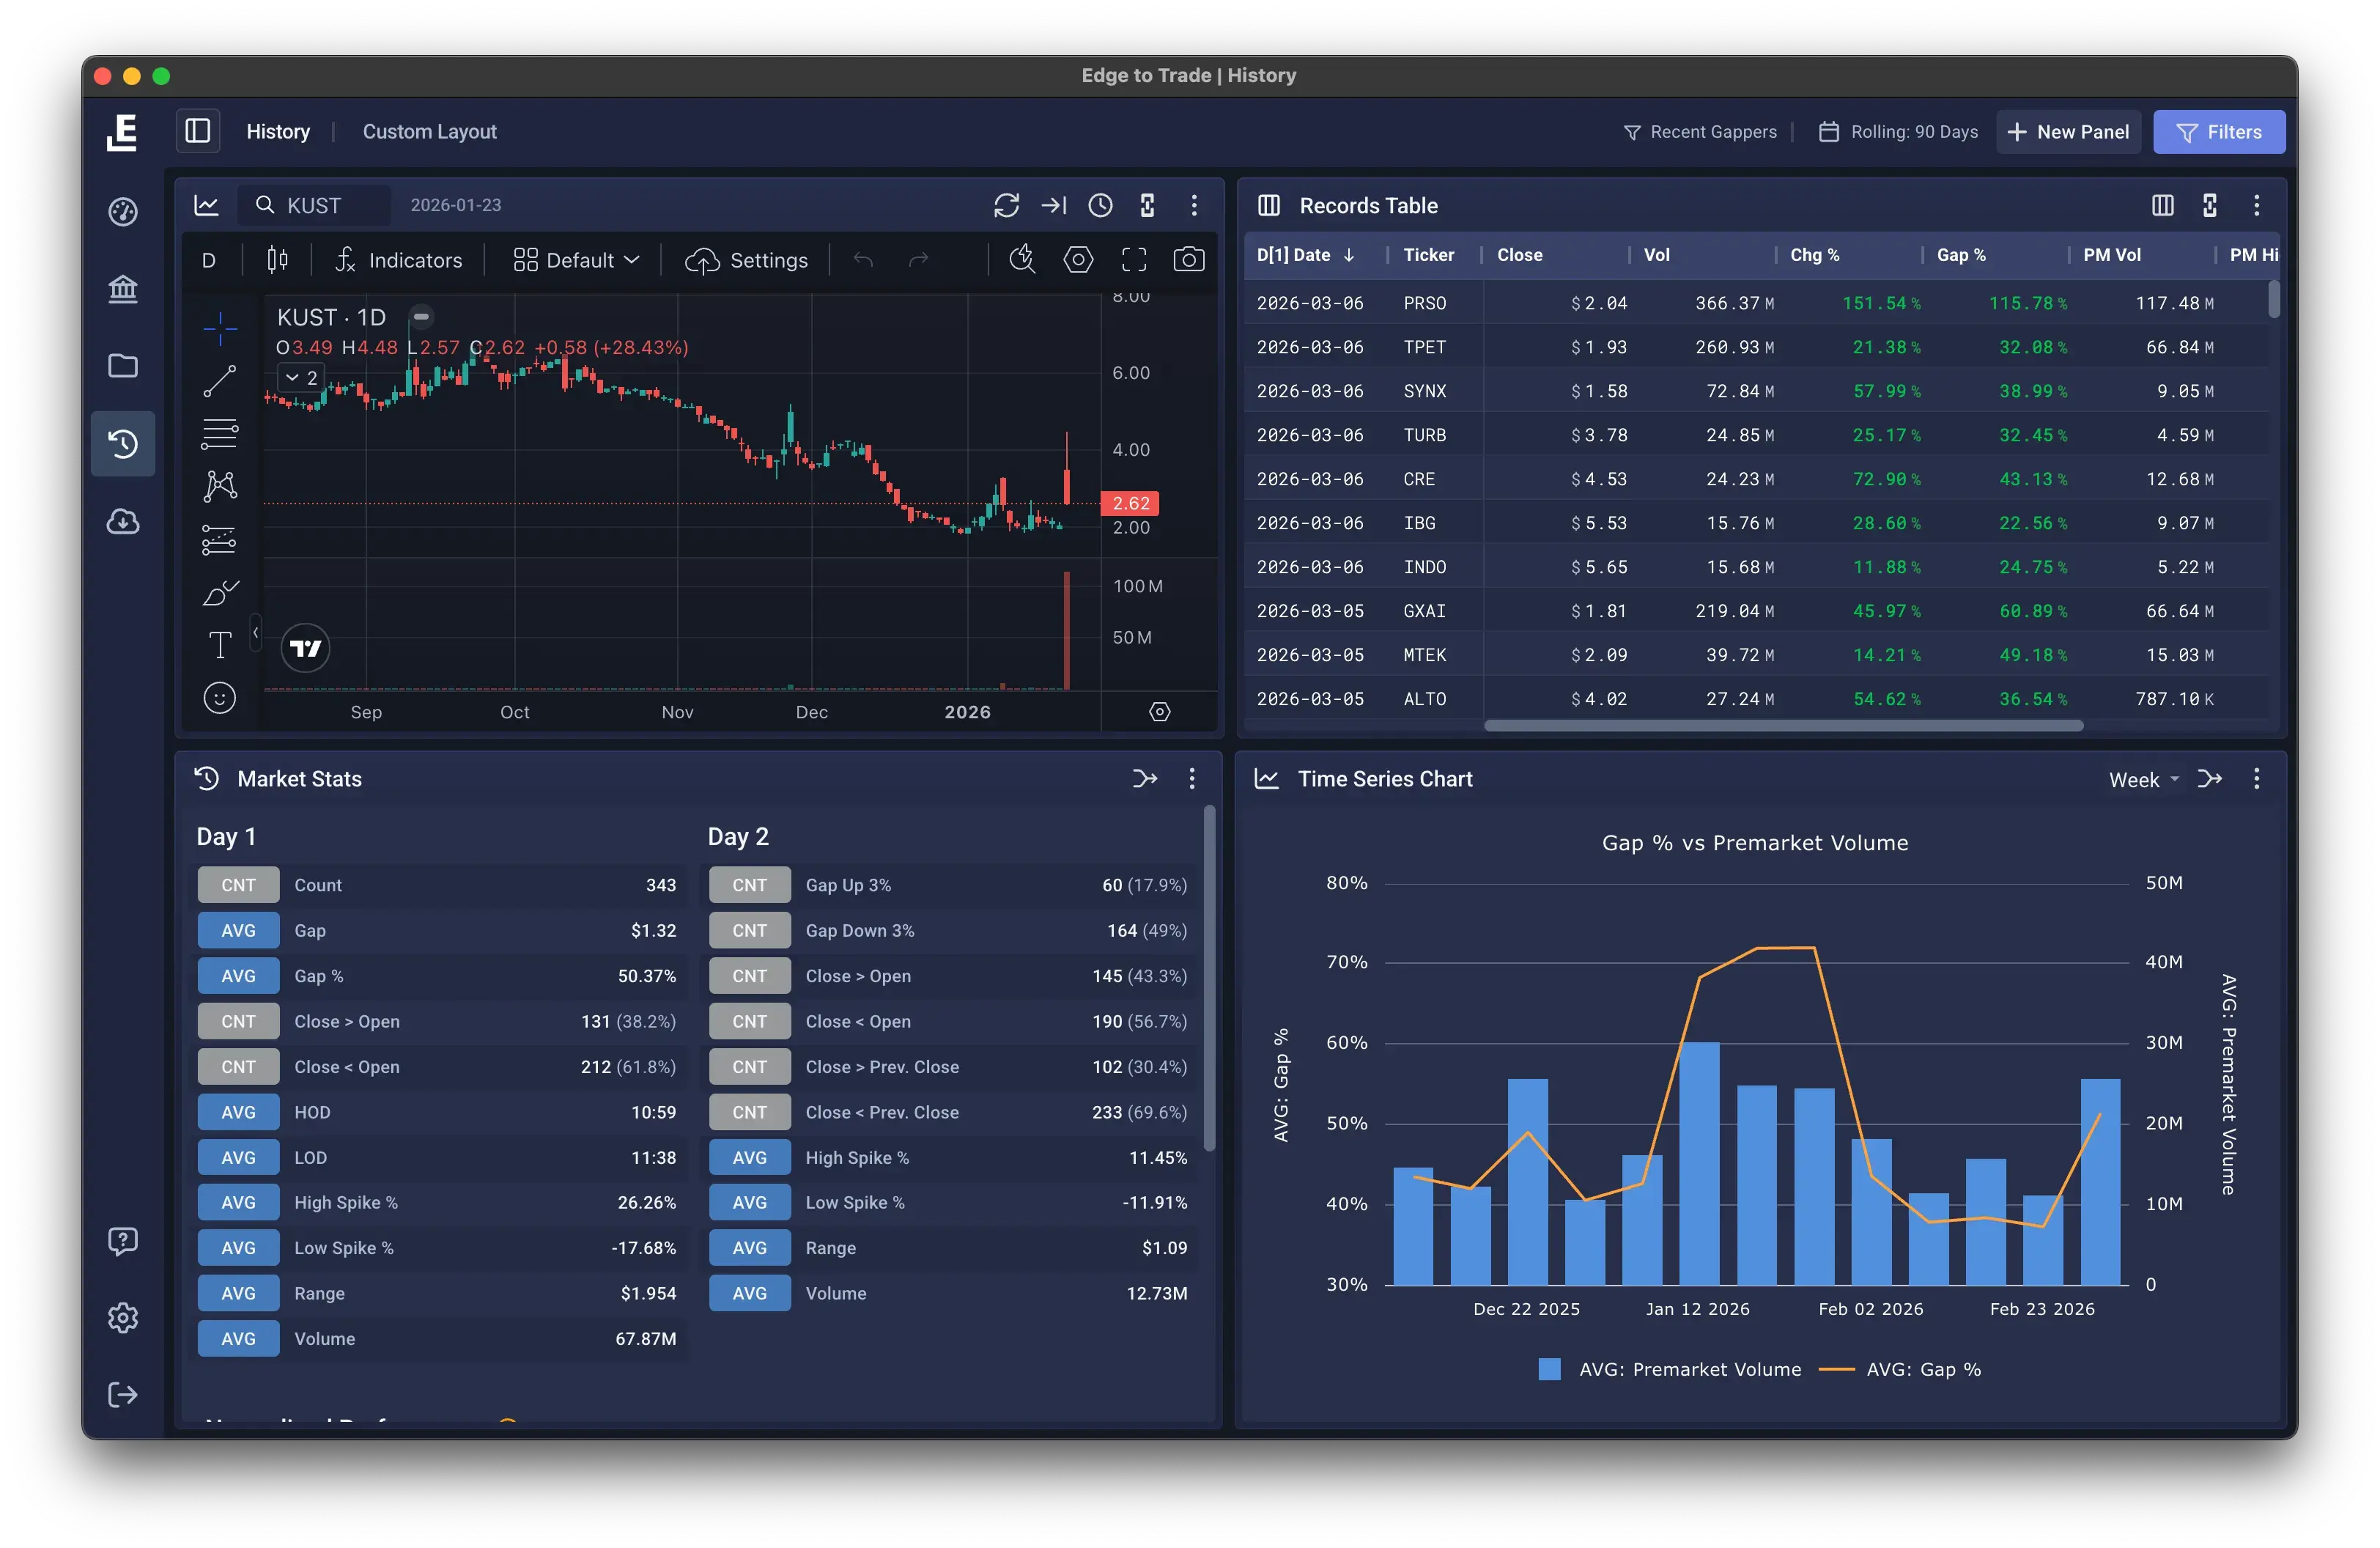
Select from 1,400+ data columns or load a saved preset. Research earnings movers, gaps, intraday breakouts, or any pattern that moves markets.
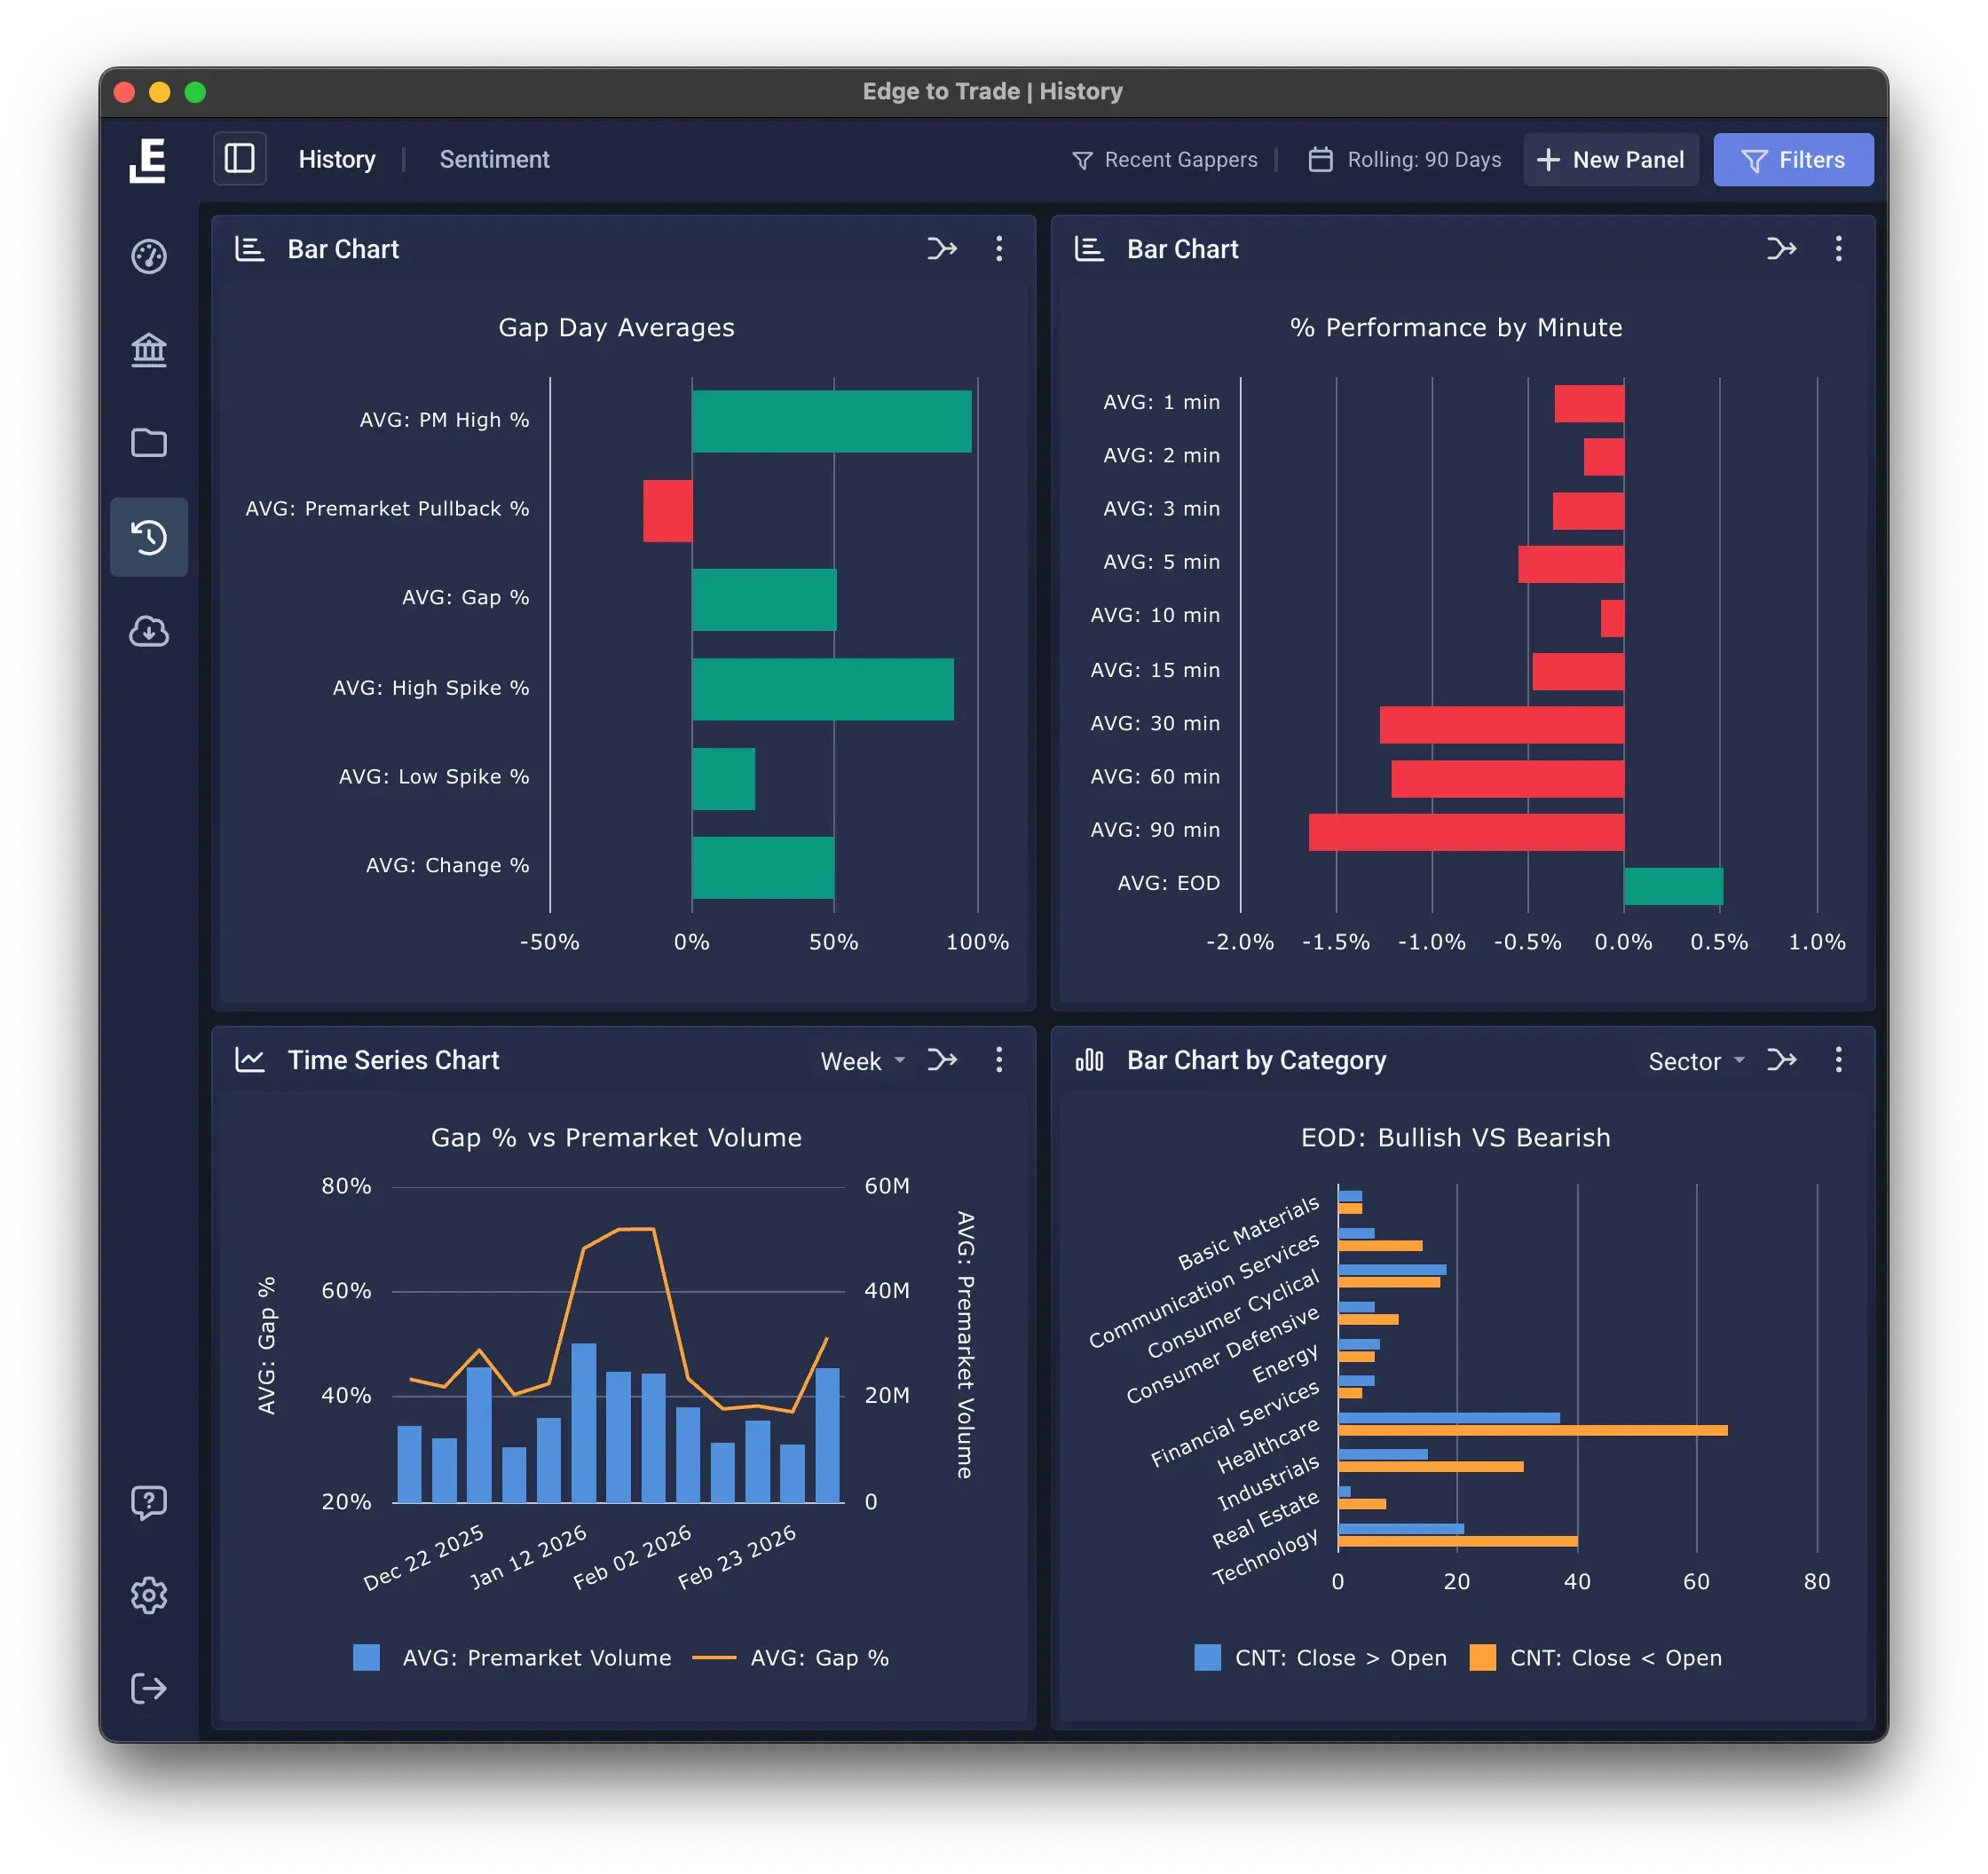
View results through customizable charts and dashboards built for traders. Excel-level analysis without the technical barriers or manual setup.
Filter by float, volume, price action, and dozens of criteria. Build your custom overwatch to see how your edge performs over time.
Analyze 15 years of market data with a tool dedicated to stock trading. No jumping between platforms or wrestling with spreadsheets. Visualize your data in seconds with layouts designed specifically for pattern recognition.
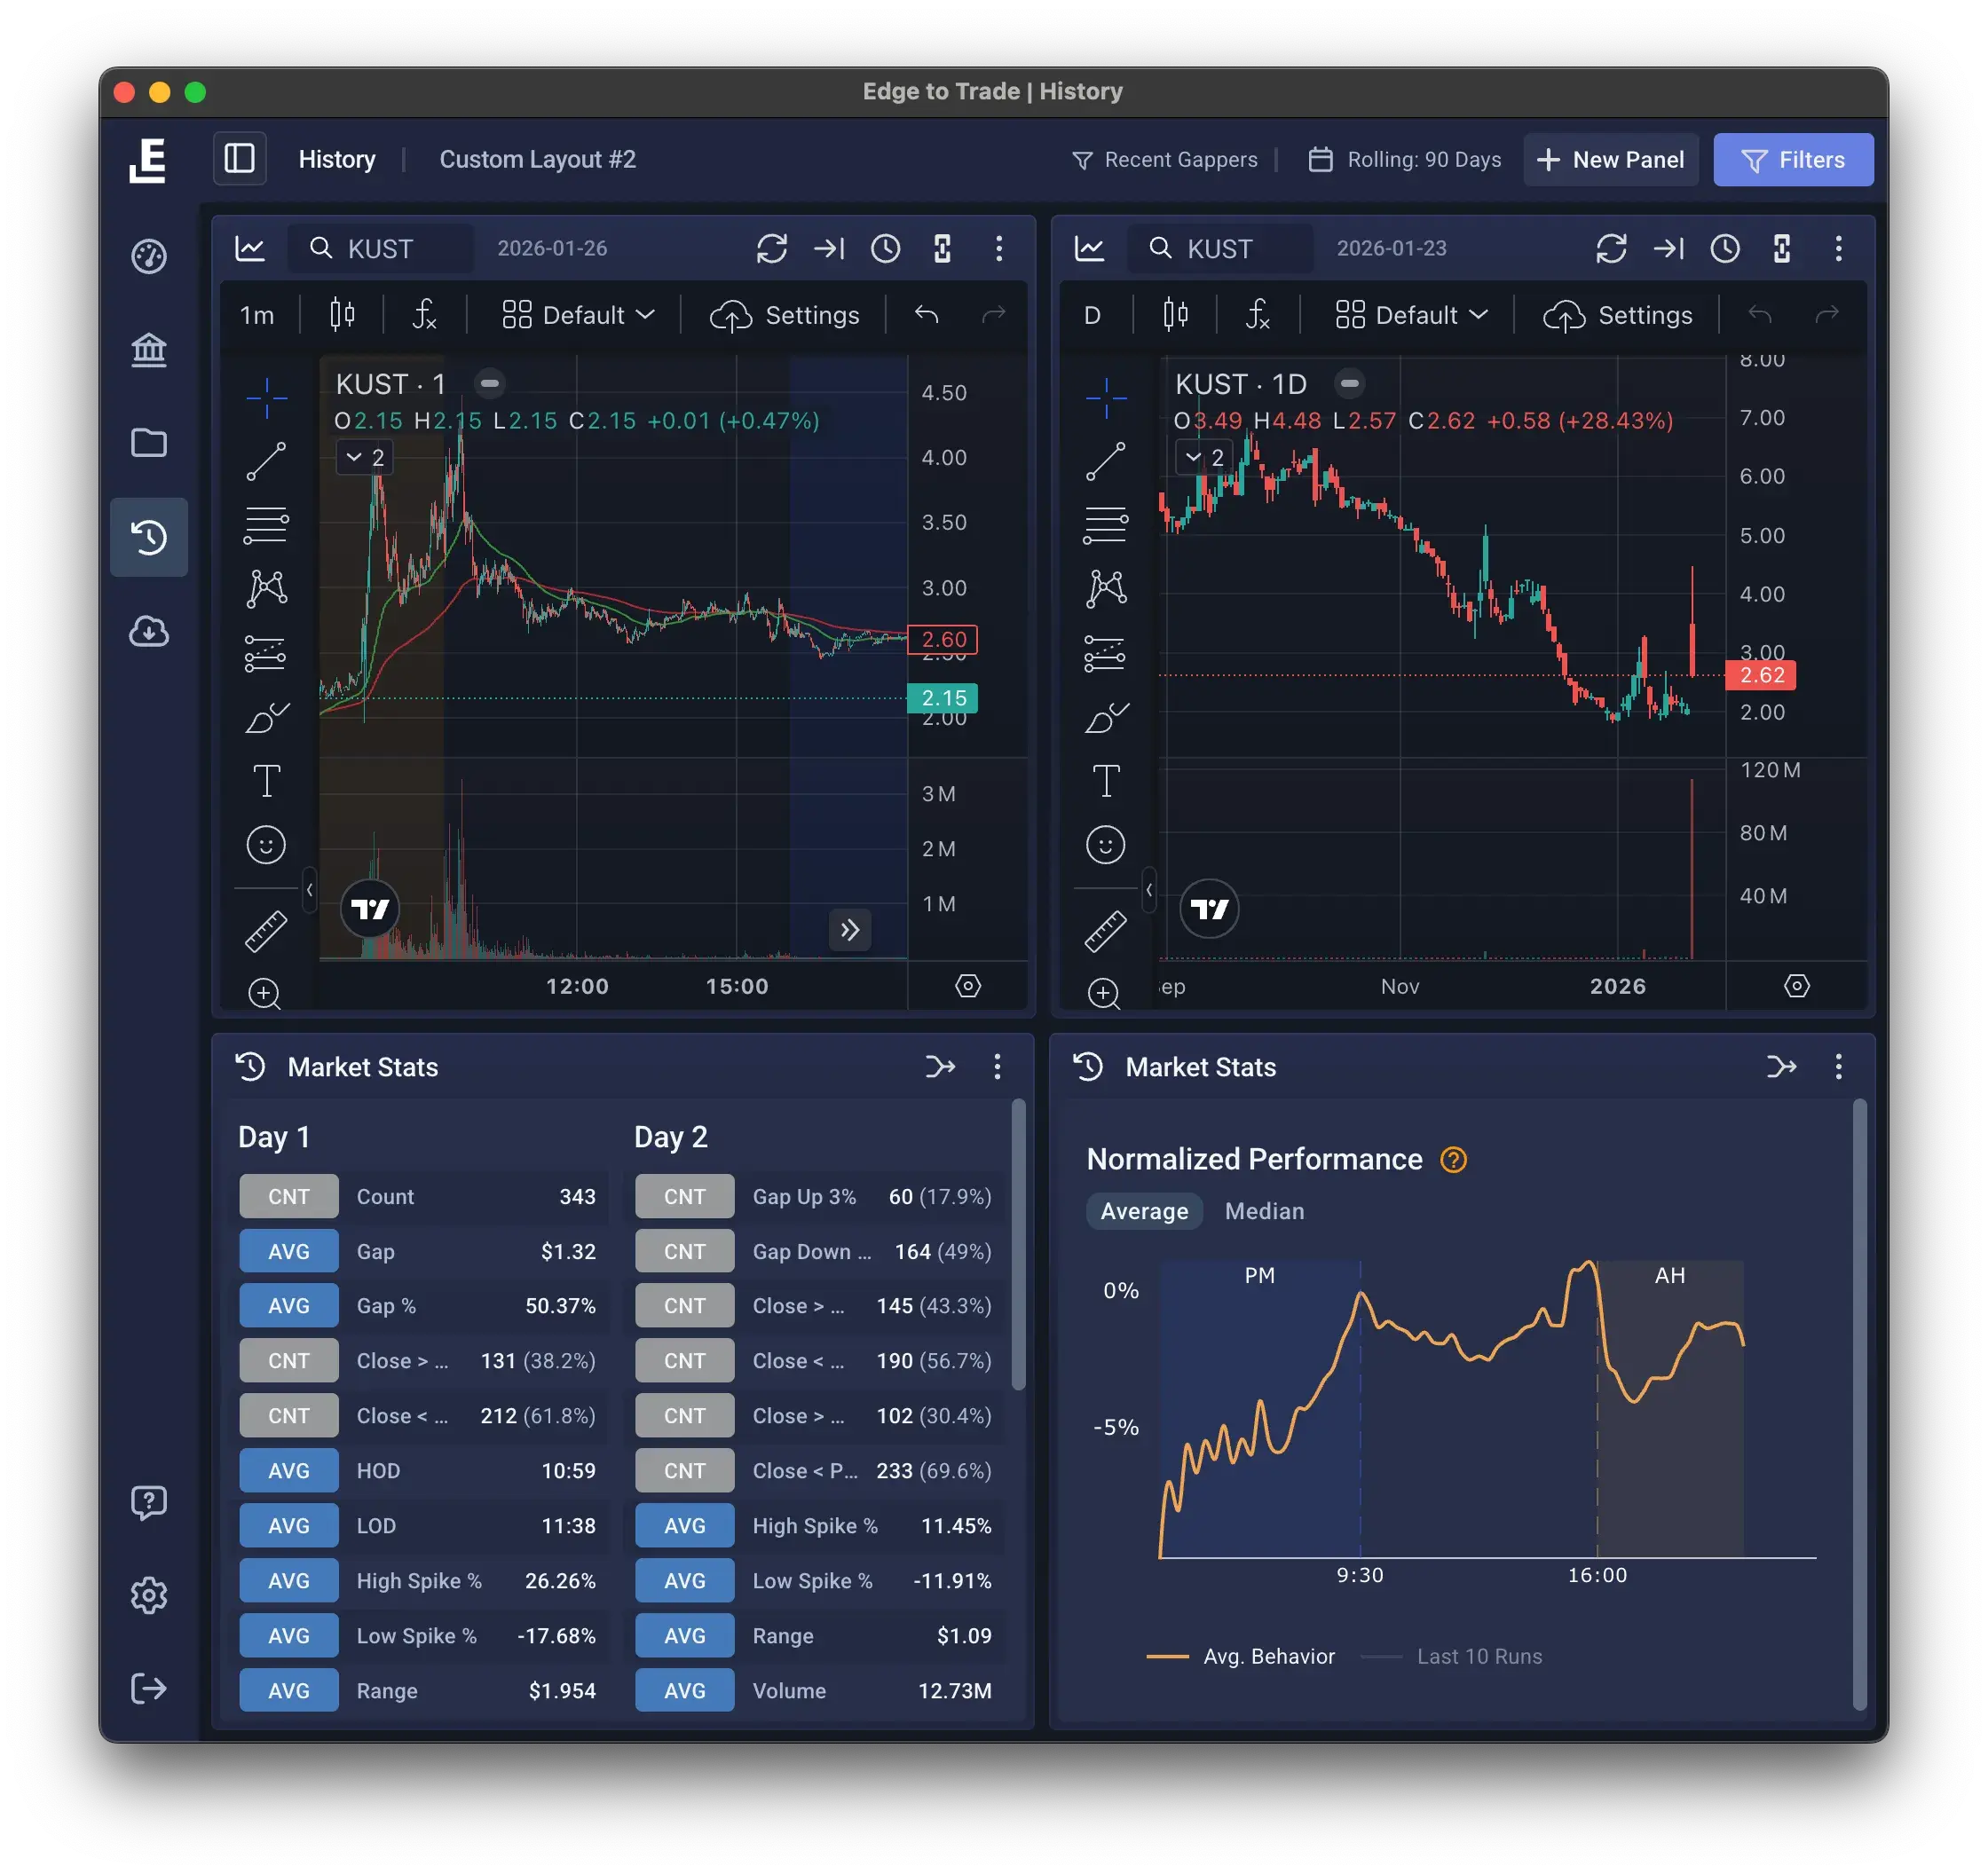
See how your specific edge performs today vs the past. What used to take hours of chart review and manual tracking now takes seconds in Edge to Trade - with data quality as if you hand-tracked it yourself.
Trader Stories
“I've been using it for years and have tried almost every other similar product. It has a strong price point, robust capabilities for backtesting, and the ability to turn those tests into actionable setup scans for you to use intraday.”
Branden W.
Day Trader
“So much information it's unreal. This scanner is so easy to use. Personally, I LOVE the gap stats. Has so much information to have the confidence to execute a trade on the short side.”
Zach E.
Short Seller
Everything you need to know about our plans and platform.
15 years of verified market data across 5,000+ trading days. Every data point is tracked with the same quality as if you had done it manually - including late print corrections and adjusted data.
Absolutely. Unlike other platforms limited to gaps, you can research earnings movers, pre-market runners, intraday breakouts, large-cap swings, after-hours movers - anything that moves. That's the power of 1,400+ custom columns.
No. While you can export to Excel if you want, the platform is designed as 'Excel on steroids for traders' - all the analytical power without the technical barriers. Ready-to-go presets let you start researching in seconds.
Yes. You can filter historical movers by float size, shares outstanding, and other share structure metrics to find patterns specific to low-float runners or large-cap momentum plays.
Adjusted data accounts for splits and dividends for long-term analysis. Unadjusted data shows actual historical prices as they traded. You can toggle between both views depending on your research needs.
Yes. Save unlimited presets with your preferred columns, filters, and chart configurations. Switch between different research setups instantly based on what you're analyzing.
Access 15 years of SEC-verified market data and pattern matching intelligence.

